Five times that data science elevated thought leadership
James Watson
It’s an old cliché that data is now more valuable than oil, but there’s a lot of truth in it. Not just for companies seeking to reinvent their business models, but also for marketers trying to reinvent – or at least refresh – the way they generate insights for their content.
One of the emerging trends we’re seeing in thought leadership is the increasing use of data science, which gives us a new and exciting way to generate content. Here are five intriguing examples we’ve seen which demonstrate the possibilities of data science.
1. New ways to track Blockchain’s startling evolution
The rise of Blockchain has been a subject of fascination and discussion over the past few years. So how does anyone find anything new or different to say? This study from Deloitte makes great use of a dataset from GitHub (a popular repository of reusable programming code) to put Blockchain’s growth into perspective.
It finds that there have been more than 86,000 Blockchain-related coding projects added to the database since 2009, with a massive spike in 2013 and 2016. The report contains a treasure trove of additional insights to add new depth to a much-covered topic.
Source: Deloitte Insights, deloitte.com/insights (Deloitte analysis of GH Torrent data and GitHub API data)
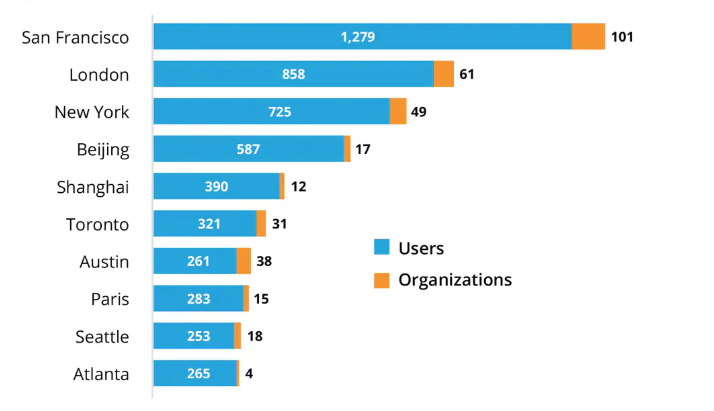
2. What are the jobs of tomorrow?
Many thought leadership studies try to extract insights from the past and extrapolate those to see what the future might look like.
This study from the World Economic Forum raised the bar on this approach, by data-mining millions of job adverts over time to explore what the jobs of tomorrow might look like. The research identified 96 jobs, spanning seven professional clusters, that are set to grow sharply in the year ahead.
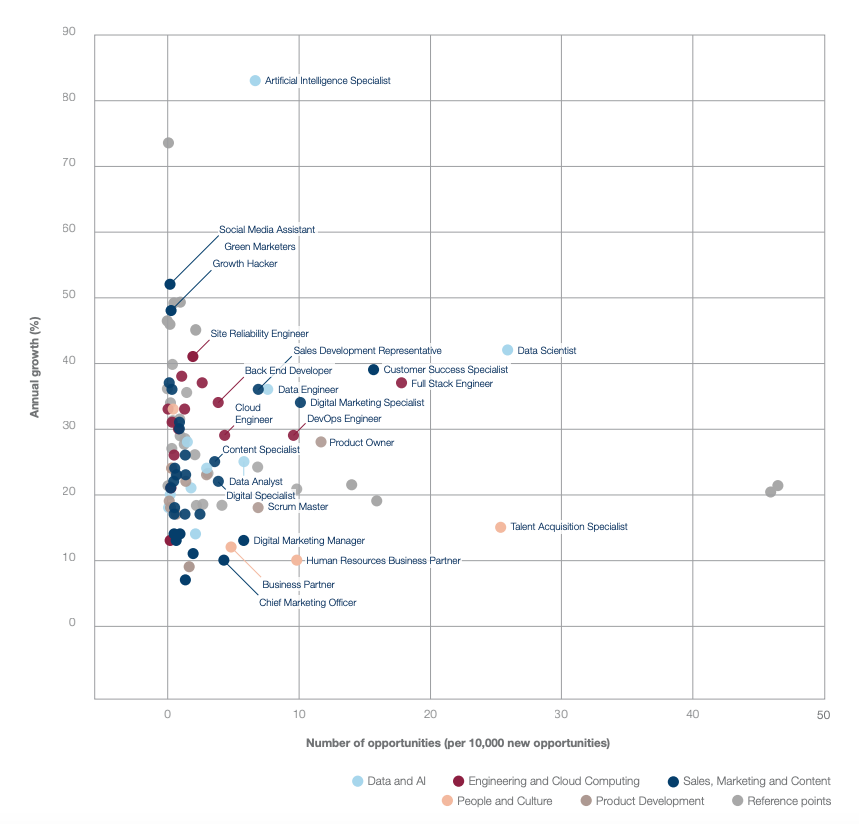
Source: Jobs of Tomorrow, Mapping Opportunity in the New Economy (World Economic Forum, January 2020)
3. How CEO reputation drives corporate reputation
The modern CEO is the face and voice of the organisation: their every word matters and can have an impact on the fortunes of the brand.
Making smart use of sentiment analysis, this study tracks how public perception of a CEO tracks against overall perception of the corporate brands they represent. The highlights? See how Uber’s fortunes moved in lockstep with the rise – and fall – of former CEO Travis Kalanick. Or the disproportionate impact on Tesla of Elon Musk’s Twitter activity.
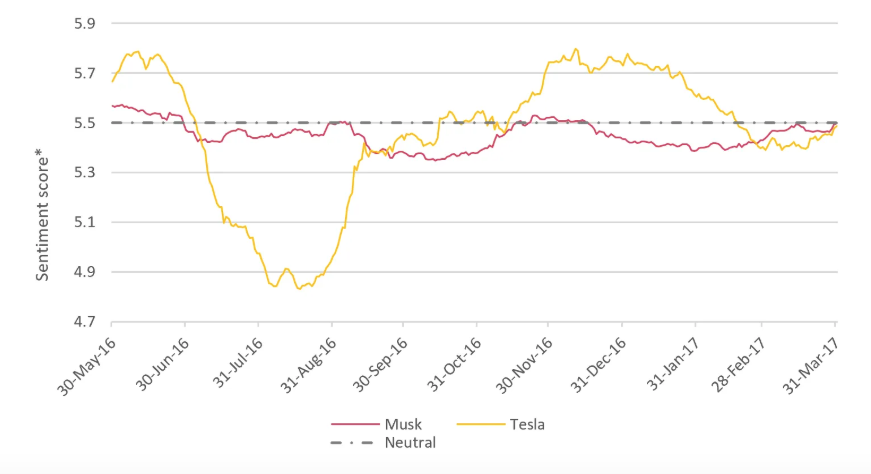
Source: Alva, CEO Reputation vs Corporate Reputation: The Elon Musk Car Crash (2018)
4. What are the Democratic presidential candidates focusing on?
Beyond sentiment analysis, data from social media can be used in a number of ways to produce insights for content campaigns.
For this study, Bloomberg scraped all 44,000 tweets from the Democratic candidates for 2020’s US presidential election and used another data science technique, topic modelling, to assign topics to each tweet. This meant they could discern each candidate’s top priorities and then use the power of data visualisation to present them in an engaging, thought-provoking way.
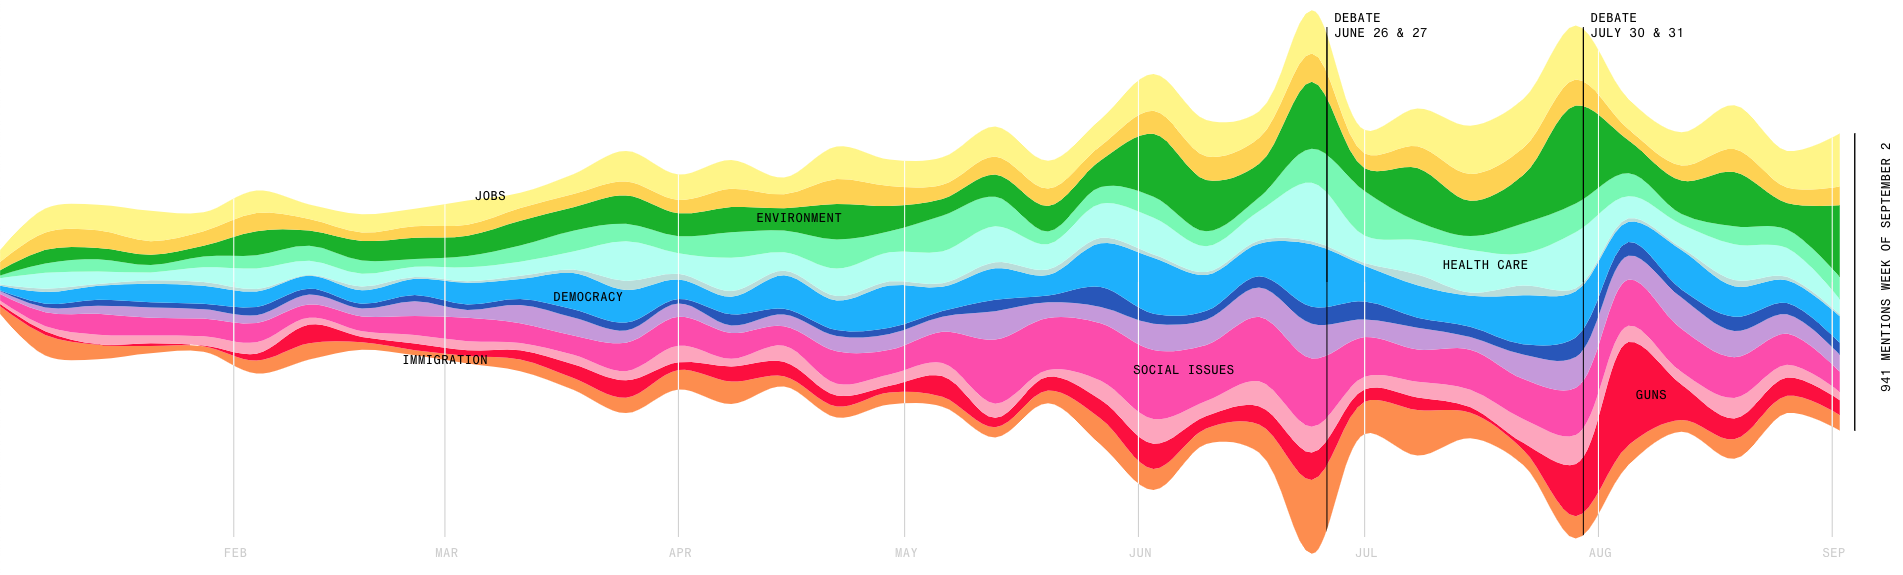
Source: Bloomberg, What the Democratic Presidential Candidates Care About, in 44,000 Tweets (2019)
5. A broadband speed map reveals the UK’s digital divide
Data science and visualisation can tell a powerful story. Using broadband data from across the UK and statistical methods to estimate broadband speed based on postcodes, this study from the FT created an interactive map that illustrates the country’s internet speed disparity.
The study identifies a surprising regional divide: unlike other studies that conclude predictably that rural areas have slower broadband than urban centres, this one finds that some of the UK’s fastest broadband postcodes are in rural communities. The best bit? The counterintuitive data directed the FT towards a small community where it interviewed local farmers to truly bring the study to life.
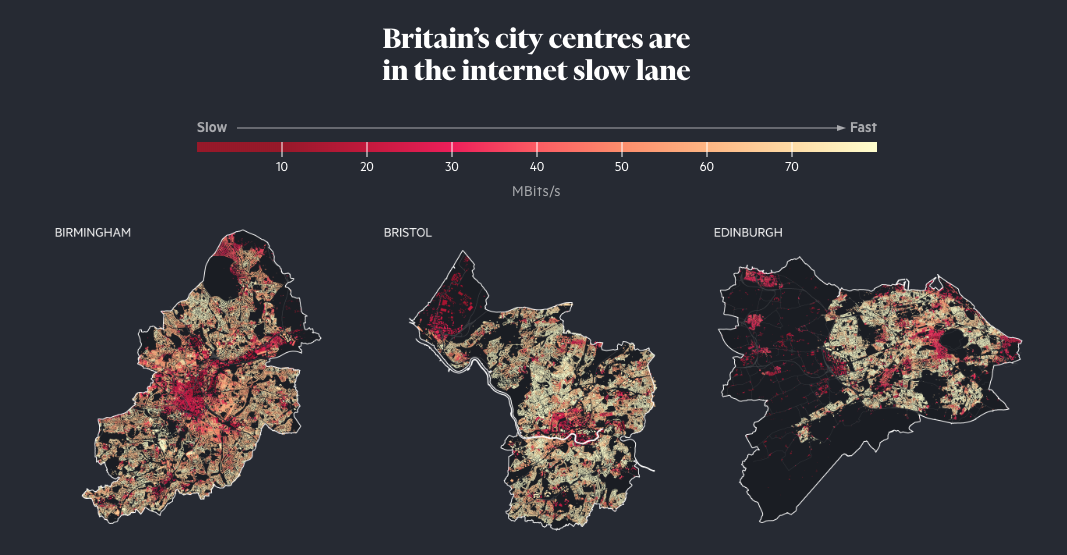
Source: FT, Broadband speed map reveals Britain’s new digital divide (2019)
These five examples are quite different in the data they use and how they use it – APIs, job adverts, sentiment analysis, tweets, broadband data – but they all show one thing: the power of data to tell a story. What you do with that data can make the difference between a good thought leadership study and a great one.
Speak to the team
We’ll help you to navigate and overcome any challenges you currently face and learn how to get more out of your content.
Book a meeting
About the author: James Watson
James is our chief operating officer and co-founder. He oversees project delivery and all the processes involved. In this role, he helps manage and coordinate the research, editorial and project management teams in order to deliver high quality thought leadership campaigns.
As an editor, he has over 15 years of experience in both business journalism and research. Some of his specialist areas of coverage include IT and technology, urban issues, energy and sustainability. Prior to co-founding FT Longitude, James spent five years at the Economist Group in the UK. Earlier, he worked in both South Africa and Singapore, reporting on the dot com boom (and bust). He is now based in Zurich, Switzerland.
 |
Tel:
+44 (0)20 7873 4770
|
Tel:
+44 (0)20 7873 4770